MACD + 200 EMA Made 37.7% While SOL Fell 47.7%. One Catch
The claim vs the data
The MACD + 200 EMA setup is sold as the trend filter that fixes MACD's false signals. We ran it on a year of Binance data across BTC, ETH and SOL, and it lost money in 4 of 6 runs after fees.
It did beat buy-and-hold every time. That sounds better than it is: the market fell hard, and losing less than a crash is not the same as making money.
The rules we tested
- Long entry: a bullish MACD cross (MACD line crosses above the signal line) that happens below the zero line, while price closes above the 200 EMA.
- Short entry: a bearish MACD cross that happens above the zero line, while price closes below the 200 EMA.
- Exit: the opposite MACD cross. The rules include no separate stop-loss or profit target.
- Indicator settings: default MACD inputs, no custom parameters.
- Fees: 0.05% per side.
- Leverage: 1x.
- Execution: signal evaluated at candle close, position opened at that close. No slippage modelled.
- Data: Binance spot candles, 2025-11-12 to 2026-11-12. That is 8,759 bars on 1h and 2,189 bars on 4h.
Results
| Symbol | Timeframe | Trades | Win rate | Net return (after fees) | Return before fees | Fees paid (% of capital) | Profit factor | Max drawdown | Buy & hold |
|---|---|---|---|---|---|---|---|---|---|
| BTCUSDT | 1h | 129 | 25.6% | -22.8% | -12.2% | 12.8% | 0.71 | -34.5% | -29.0% |
| BTCUSDT | 4h | 36 | 38.9% | -5.1% | -1.6% | 3.6% | 0.91 | -14.6% | -28.0% |
| ETHUSDT | 1h | 133 | 31.6% | -21.2% | -9.9% | 13.3% | 0.81 | -29.8% | -41.3% |
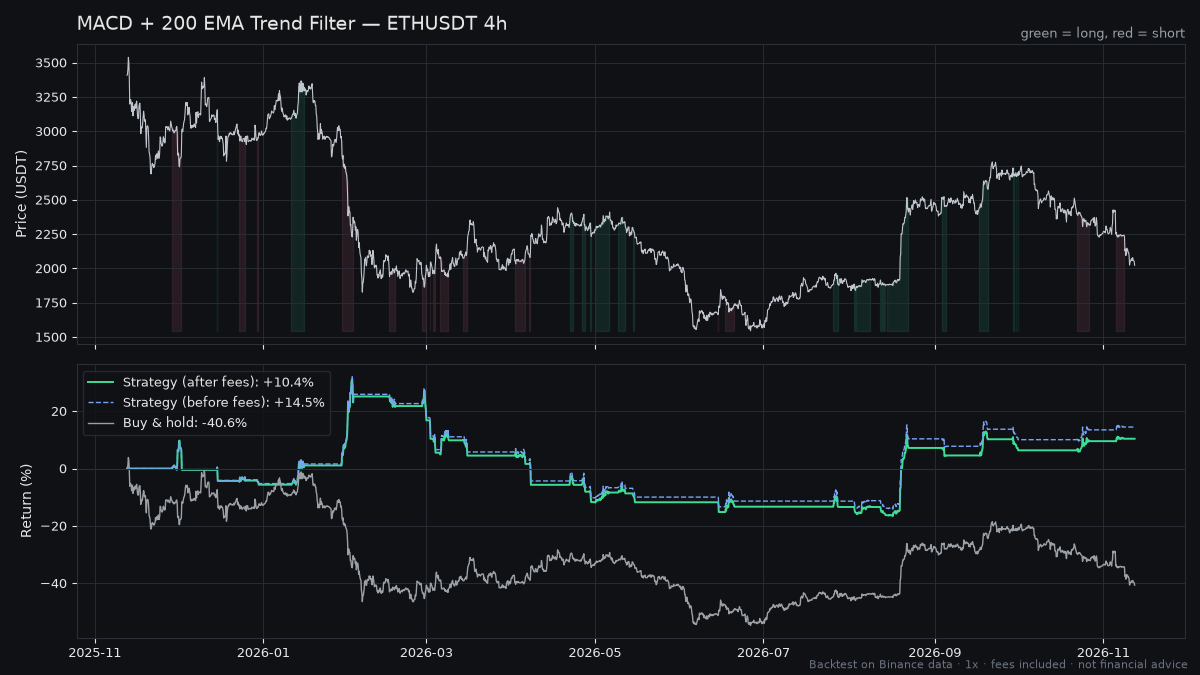
| ETHUSDT | 4h | 36 | 30.6% | +10.4% | +14.5% | 3.6% | 1.28 | -36.4% | -40.6% |
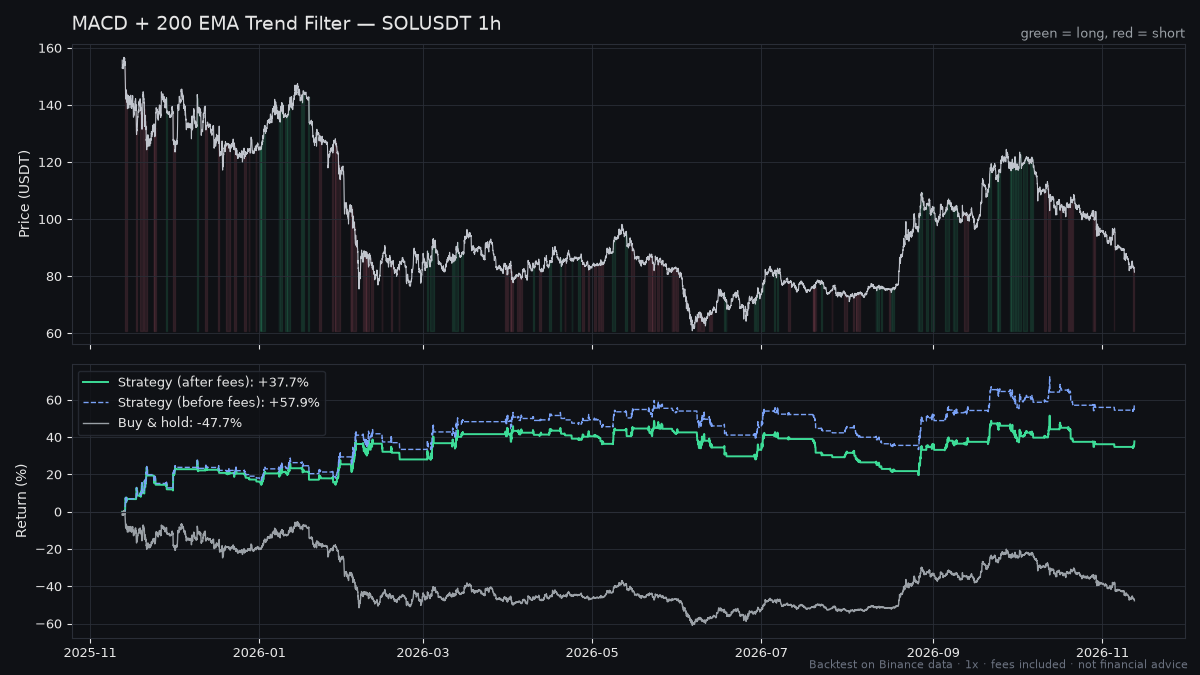
| SOLUSDT | 1h | 137 | 35.0% | +37.7% | +57.9% | 13.6% | 1.35 | -19.6% | -47.7% |
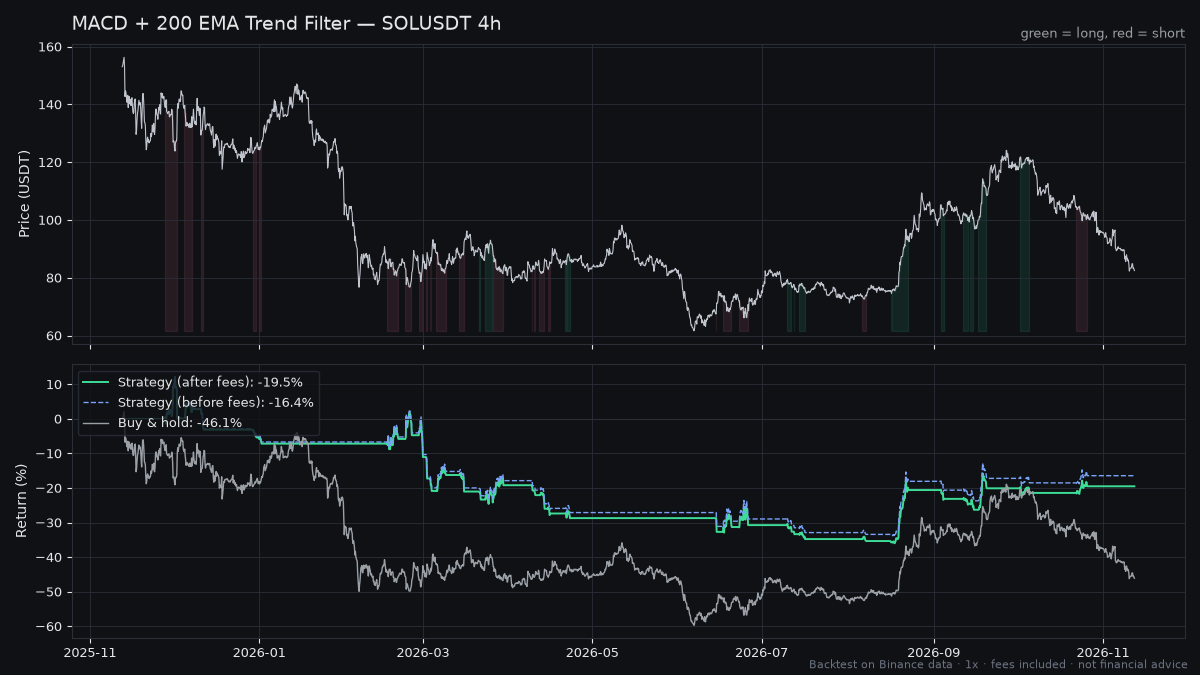
| SOLUSDT | 4h | 37 | 29.7% | -19.5% | -16.4% | 3.7% | 0.76 | -42.9% | -46.1% |
The two most informative charts are the same coin with the same rules on different timeframes. SOL 1h was the best run:
SOL 4h was one of the worst, with the deepest drawdown of all six runs:
ETH 4h, the only other profitable run, shows what a winning result with a large drawdown looks like:
What the numbers actually say
1. Win rate told us nothing about profit. The highest win rate was BTC 4h at 38.9%, and it still lost -5.1%. SOL 1h won only 35.0% of its trades but made +37.7%, because its average win (3.02%) was far larger than its average loss (-1.21%). ETH 4h won just 30.6% of the time and was profitable on an average win of 7.33% against an average loss of -2.52%. Every run lost more trades than it won. This system lives or dies on the size of its few winners.
2. Fees are the hidden second opponent on 1h. The 1h runs traded 129 to 137 times and paid 12.8% to 13.6% of capital in fees. BTC 1h went from -12.2% before fees to -22.8% after. ETH 1h went from -9.9% to -21.2%. Even the winner, SOL 1h, dropped from +57.9% to +37.7%. The 4h runs made 36 to 37 trades and paid only 3.6% to 3.7%. And no slippage was modelled, so real 1h costs would likely be higher, not lower.
3. Beating buy & hold is mostly a bear-market effect. All six runs beat buy & hold, but holding lost between -28.0% and -47.7% over this period. Finishing at -22.8% on BTC 1h versus -29.0% for holding is still a loss. The strategy looks good on this comparison partly because it can sit flat or go short while price falls. We have not tested it in a rising market, and nothing here says it would keep up with one.
4. Drawdowns were large, even in winning runs. ETH 4h finished +10.4% but went through a -36.4% drawdown on the way. SOL 4h hit -42.9%. BTC 1h hit -34.5%. Only BTC 4h kept its worst drop at -14.6%. These are 1x results. Leverage multiplies drawdowns too, and drawdowns this size at leverage end accounts.
5. The results are not consistent. SOL 1h was the best run (+37.7%, Sharpe 1.2). SOL 4h, same coin and same rules, lost -19.5% with a Sharpe of -0.59. BTC lost on both timeframes. When one run out of six looks great and its neighbour on the same asset looks bad, that is not a robust edge. It is noise you could easily mistake for one.
How to test it yourself on TradingView
- Open a Binance spot chart for BTCUSDT, ETHUSDT or SOLUSDT and set the timeframe to 1h or 4h.
- Add the MACD indicator with its default inputs, and an EMA with length 200.
- Write or load a Pine Script strategy that goes long on a MACD crossover below zero with close above the 200 EMA, goes short on a crossunder above zero with close below the 200 EMA, and closes on the opposite cross.
- In the strategy Properties, set commission to 0.05% per order and size each trade at your full equity with no leverage (1x). Turn pyramiding off.
- Restrict the backtest to 2025-11-12 through 2026-11-12 and compare the Strategy Tester numbers with our table. Expect small differences from fill assumptions.
- Then run what we did not: other date ranges, especially a rising market. One year in one regime is a thin sample.
Verdict
This is not a strategy to run as-is. It lost money in 4 of 6 runs, no run won more than 38.9% of its trades, and drawdowns reached -42.9%. What it did do was lose less than holding during a year when BTC, ETH and SOL all fell. If it suits anyone, it is a trader who wants a rules-based way to step aside or lean short in a downtrend, on the 4h chart where fees stayed at 3.6% to 3.7% of capital instead of 12.8% to 13.6% on 1h. Before trusting it, add a real stop-loss to cap those drawdowns, stay on higher timeframes to cut fee drag, and test it across a bull market. Do not take the SOL 1h result as proof of anything on its own.
FAQ
Does the MACD 200 EMA strategy work for crypto? Not reliably in our test. Over 2025-11-12 to 2026-11-12 it lost money in 4 of 6 BTC, ETH and SOL runs after fees. Only SOL 1h (+37.7%) and ETH 4h (+10.4%) were profitable, and it beat buy & hold mainly because holding lost 28.0% to 47.7%.
What is the best timeframe for the MACD + 200 EMA strategy? There was no clear winner. 4h cut fees to 3.6% to 3.7% of capital versus 12.8% to 13.6% on 1h, but the single best run was SOL 1h and the worst drawdown (-42.9%) was SOL 4h. A higher timeframe lowered costs, not risk.
Why is the win rate of MACD crossover strategies so low? Crossover systems take many small losses while waiting for a few larger trend moves. In our runs win rates ranged from 25.6% to 38.9%. Whether a run made money depended on how big the average win was compared with the average loss, not on how often it won.