EMA 9/21 Crossover Lost 65.2% on ETH. 0 of 6 Tests Won
The claim vs the data
The EMA 9/21 crossover is often pitched as a simple trend-following signal that keeps you on the right side of the move. We ran it on a full year of Binance data for BTC, ETH and SOL on the 1h and 4h charts.
All six runs lost money after fees. Four of the six lost more than simply holding, in a year when holding was already negative.
The rules we tested
The setup is deliberately plain, so anyone can reproduce it:
- Indicators: EMA 9 (fast) and EMA 21 (slow).
- Entry/exit: Long while EMA 9 is above EMA 21. Short while EMA 9 is below EMA 21. The strategy is always in the market: each cross closes the current position and opens the opposite one.
- Execution: Signal evaluated at candle close; position opened at that same close. No slippage modelled.
- Fees: 0.05% per side.
- Leverage: 1x.
- Data: Binance spot candles from the public market data API.
- Period: 2025-11-12 to 2026-11-12 (8,759 bars on 1h, 2,189 bars on 4h).
- Markets: BTCUSDT, ETHUSDT, SOLUSDT on 1h and 4h.
Results
| Symbol | Timeframe | Trades | Win rate | Net return (after fees) | Return before fees | Fees paid (% of capital) | Profit factor | Max drawdown | Buy & hold |
|---|---|---|---|---|---|---|---|---|---|
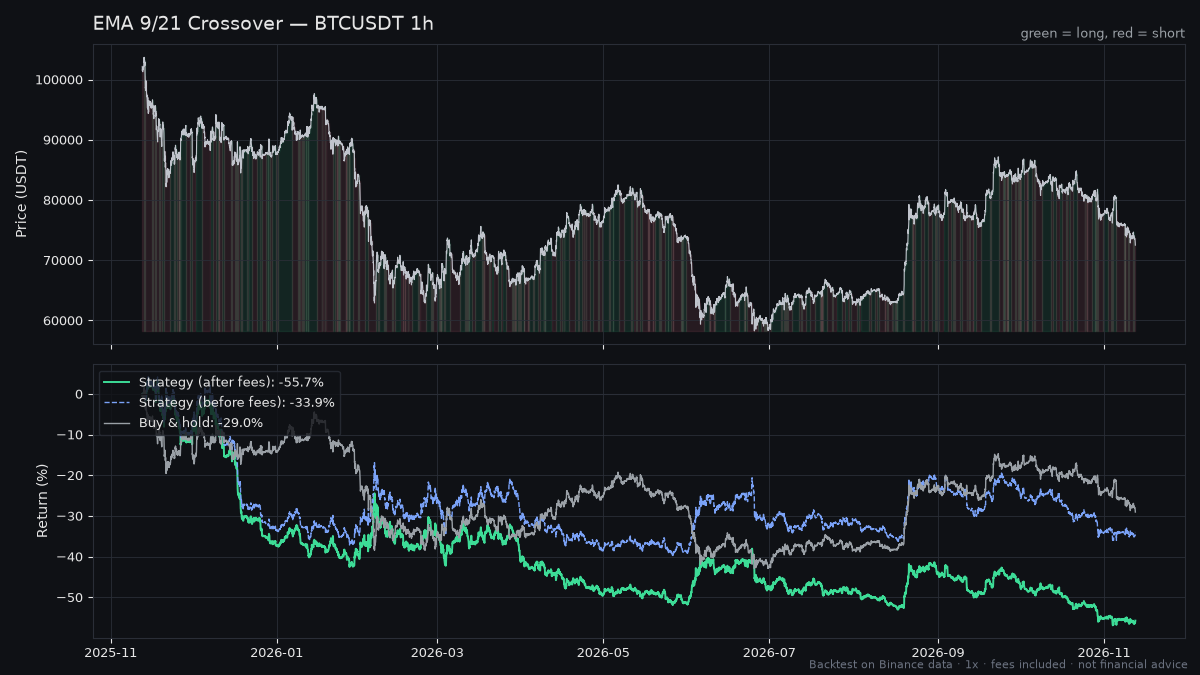
| BTCUSDT | 1h | 399 | 27.1% | -55.7% | -33.9% | 39.8% | 0.76 | -58.5% | -29.0% |
| BTCUSDT | 4h | 112 | 26.8% | -47.5% | -41.3% | 11.2% | 0.69 | -56.4% | -28.0% |
| ETHUSDT | 1h | 427 | 26.0% | -47.8% | -19.8% | 42.6% | 0.88 | -55.1% | -41.3% |
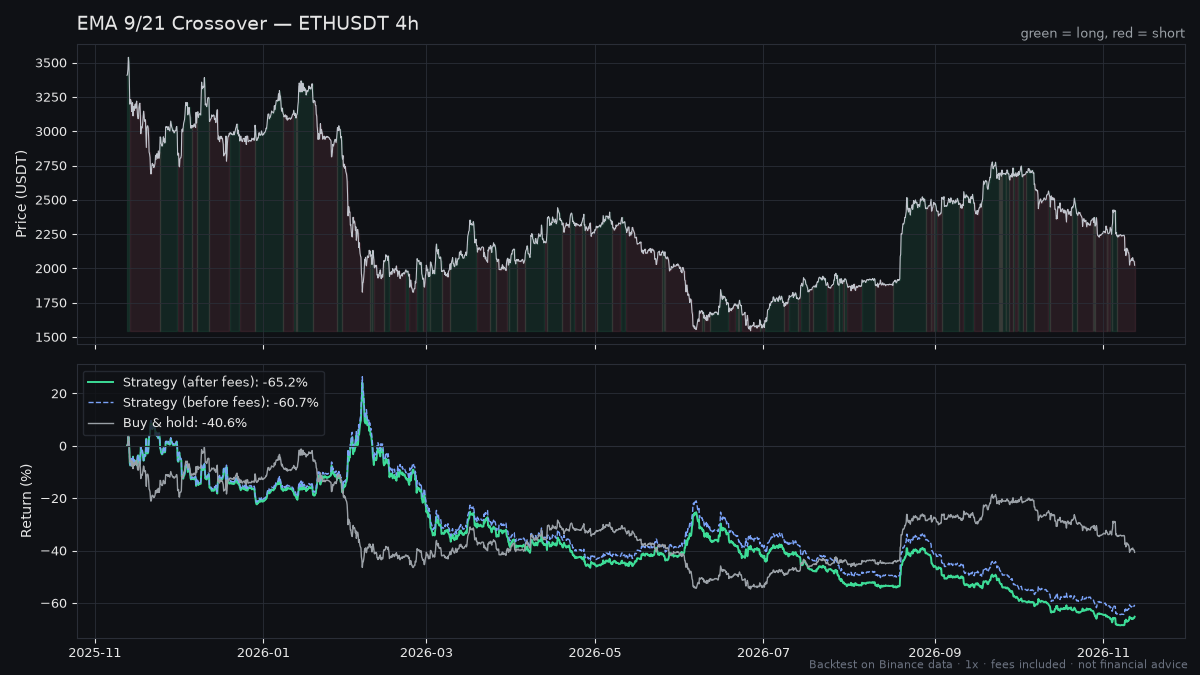
| ETHUSDT | 4h | 122 | 21.3% | -65.2% | -60.7% | 12.2% | 0.62 | -74.6% | -40.6% |
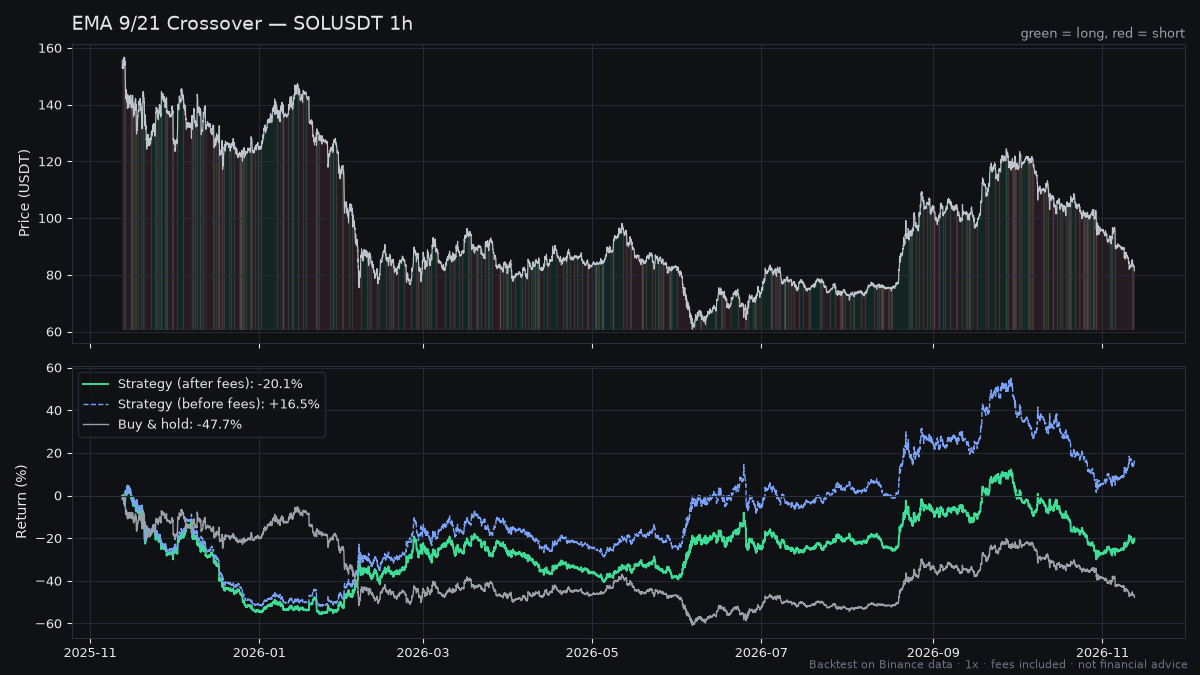
| SOLUSDT | 1h | 375 | 27.7% | -20.1% | +16.5% | 37.4% | 0.99 | -57.6% | -47.7% |
| SOLUSDT | 4h | 102 | 21.6% | -31.1% | -23.7% | 10.2% | 0.93 | -53.7% | -46.1% |
The most instructive run is SOL on the 1h chart: the only one that made money before fees, and it still finished at -20.1%.
The worst run was ETH on the 4h chart, with a -65.2% net return and a -74.6% max drawdown.
BTC on 1h shows what happens when a weak signal trades often: 399 trades and 39.8% of capital paid in fees.
What the numbers actually say
1. The low win rate is normal. The problem is the wins weren't big enough. Win rates ranged from 21.3% to 27.7%. That alone isn't fatal for a trend follower, and the shape was right: average wins beat average losses on every run (SOL 4h: +8.99% average win vs -2.66% average loss). But profit factor came in below 1 on all six runs, from 0.62 to 0.99. Losing trades added up to more than winning trades every time.
2. Fees decided the outcome on 1h. The 1h runs placed 375 to 427 trades and paid 37.4% to 42.6% of capital in fees at just 0.05% per side. SOL 1h went from +16.5% before fees to -20.1% after. ETH 1h went from -19.8% to -47.8%. If your exchange charges more, or you add real slippage, these numbers get worse, not better.
3. Trading less didn't fix it. The 4h runs cut fees to 10.2% to 12.2% of capital. But the before-fee results were worse on 4h than on 1h for all three coins (BTC -41.3% vs -33.9%, ETH -60.7% vs -19.8%, SOL -23.7% vs +16.5%). Fewer trades lowered costs, but the raw signal was weaker in this period.
4. It lost to buy and hold in a falling market. Buy and hold was negative everywhere, from -28.0% to -47.7%. A long/short trend system should, in theory, earn its keep in a down year. Instead, BTC and ETH did worse than holding on both timeframes. SOL lost less than holding (-20.1% vs -47.7% on 1h, -31.1% vs -46.1% on 4h), but a smaller loss is still a loss.
5. The drawdowns are severe at 1x. Max drawdowns ranged from -53.7% to -74.6%, and Sharpe ratios were negative on every run (from -0.03 to -1.66). These are unleveraged results. Leverage multiplies drawdowns too, and a strategy that already fell more than half at 1x has no room for it.
How to test it yourself on TradingView
- Open a Binance BTCUSDT, ETHUSDT or SOLUSDT chart and set it to 1h or 4h.
- Add two EMA indicators with lengths 9 and 21, source set to close.
- To backtest, open the Pine Editor and write a simple strategy: go long when the 9 EMA crosses above the 21 EMA and go short when it crosses below. Using strategy entries in both directions makes it reverse automatically, like our version.
- In the strategy Properties, set commission to 0.05% per order, size to 100% of equity, and no pyramiding. Leave slippage off to match our test, then add some to see how fragile the result is.
- Limit the test to 2025-11-12 through 2026-11-12 and compare the Strategy Tester's net profit and max drawdown to the table above. Expect small differences from data and fill handling.
- Compare against simply holding the coin over the same dates. That is the bar any strategy has to clear.
Verdict
As tested, the EMA 9/21 crossover doesn't suit anyone as a standalone, always-in-the-market system. It lost money on every symbol and timeframe after fees, lost money before fees in five of six runs, and lost to buy and hold on BTC and ETH. The closest it came to working was SOL 1h, with a profit factor of 0.99 and +16.5% before fees. That tells you any edge here is smaller than ordinary trading costs. If you still want to use it, treat it as a trend filter rather than a trigger. Ideas worth testing (we haven't tested them here): a higher-timeframe trend filter, a long-only or flat-when-unclear version, and rules that cut trade frequency. Test them over more than one year before trusting them.
FAQ
Does the EMA 9/21 crossover work for crypto? Not in our test. On one year of Binance data for BTC, ETH and SOL, all six runs lost money after 0.05% per-side fees, with net returns from -20.1% to -65.2%.
What is the best timeframe for the 9 and 21 EMA crossover? Neither timeframe we tested was profitable. The 1h chart paid far more in fees (37.4% to 42.6% of capital). The 4h chart paid less (10.2% to 12.2%) but had worse before-fee returns on all three coins.
Is the 9/21 EMA crossover good for day trading? Shorter timeframes mean more trades and more fees. On 1h alone the strategy made 375 to 427 trades in a year, and fees turned SOL's +16.5% before fees into -20.1% after. Going lower would likely mean even more trades to pay for.