Bollinger Bands Won 68.2% of Trades — and Lost on Every Coin
The claim vs the data
Bollinger Bands mean reversion is usually sold as the high-win-rate strategy: fade the lower band, fade the upper band, collect. The win-rate part held up. Across our six runs it won 60.1% to 68.2% of trades. The collecting part did not. Every run lost money after fees.
The rules we tested
- Indicator: Bollinger Bands, length 20, multiplier 2.0 (n = 20, k = 2.0). The middle band is the 20-period simple moving average.
- Long entry: price closes back inside the lower band after being below it.
- Short entry: price closes back inside the upper band after being above it.
- Exit: close the position at the middle band. No stop-loss or time stop is part of the rules as tested.
- Execution: signals are evaluated at the candle close and the position is opened at that close. No slippage modelled.
- Fees: 0.05% per side, charged on entry and exit.
- Leverage: 1x. Leverage multiplies drawdowns as well as returns.
- Data: Binance spot candles from the public market data API.
- Markets and period: BTCUSDT, ETHUSDT and SOLUSDT on 1h (8759 bars) and 4h (2189 bars), from 2025-11-12 to 2026-11-12.
Shorts are simulated on spot prices. Doing this live needs a margin or derivatives account, which brings costs we did not model.
Results
| Symbol | Timeframe | Trades | Win rate | Avg win / avg loss | Net return (after fees) | Return before fees | Max drawdown | Buy & hold |
|---|---|---|---|---|---|---|---|---|
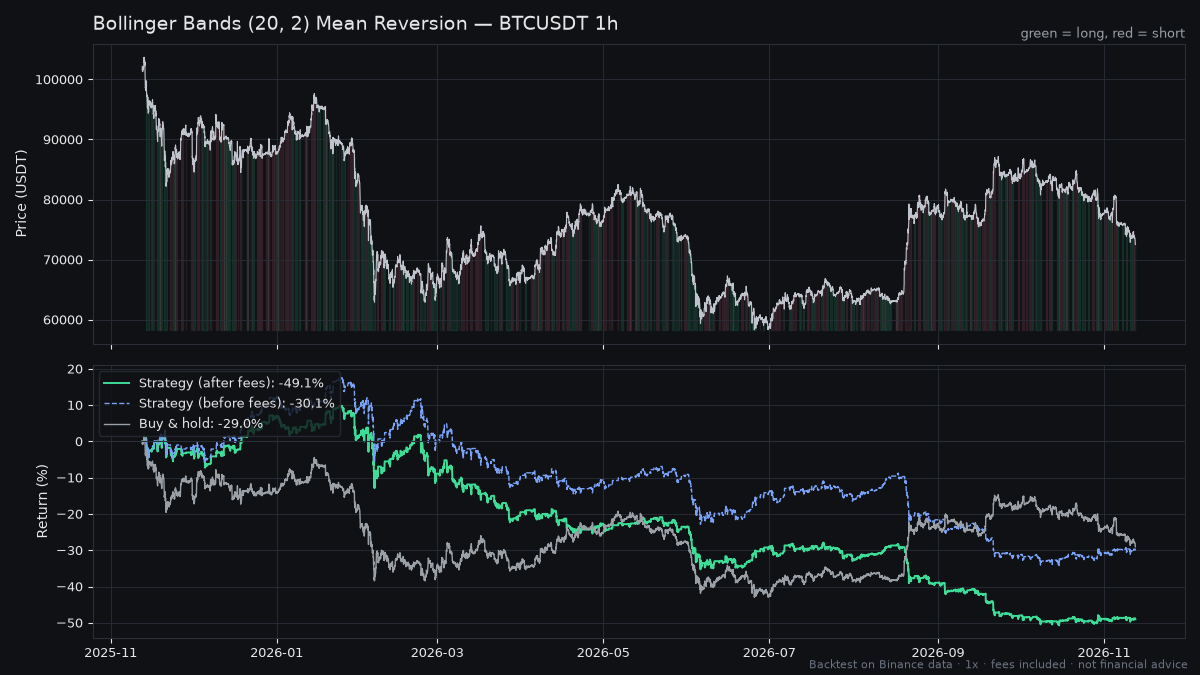
| BTCUSDT | 1h | 318 | 60.1% | +0.64% / -1.46% | -49.1% | -30.1% | -55.1% | -29.0% |
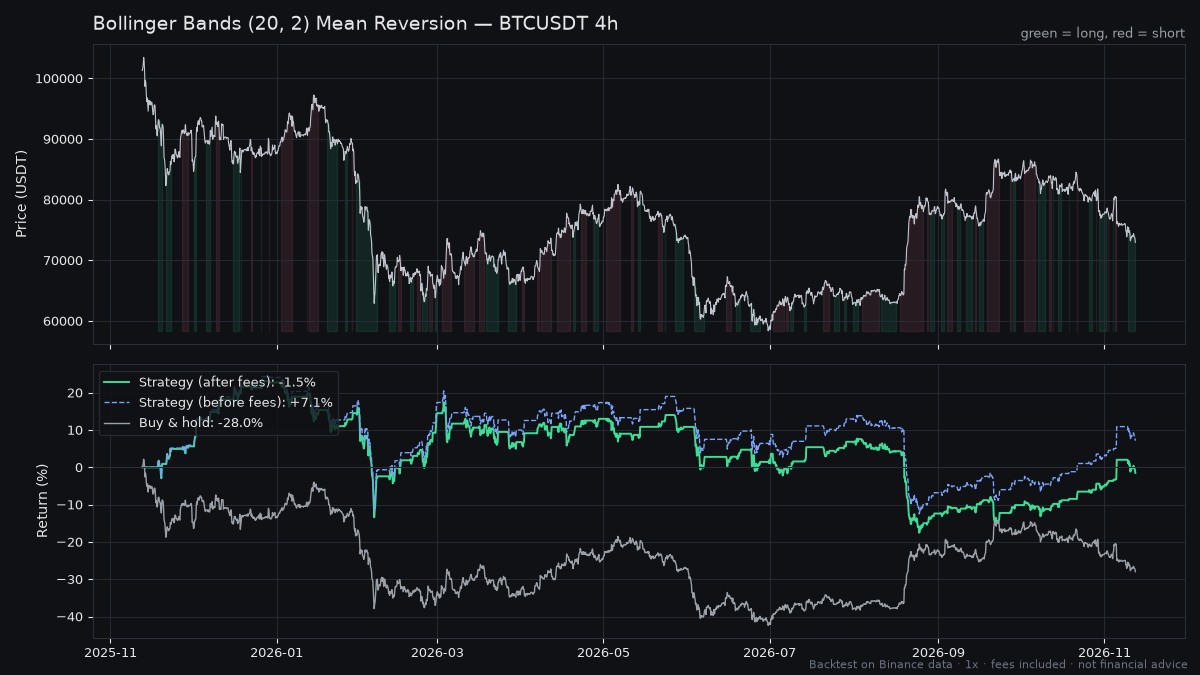
| BTCUSDT | 4h | 85 | 67.1% | +1.62% / -3.16% | -1.5% | +7.1% | -33.0% | -28.0% |
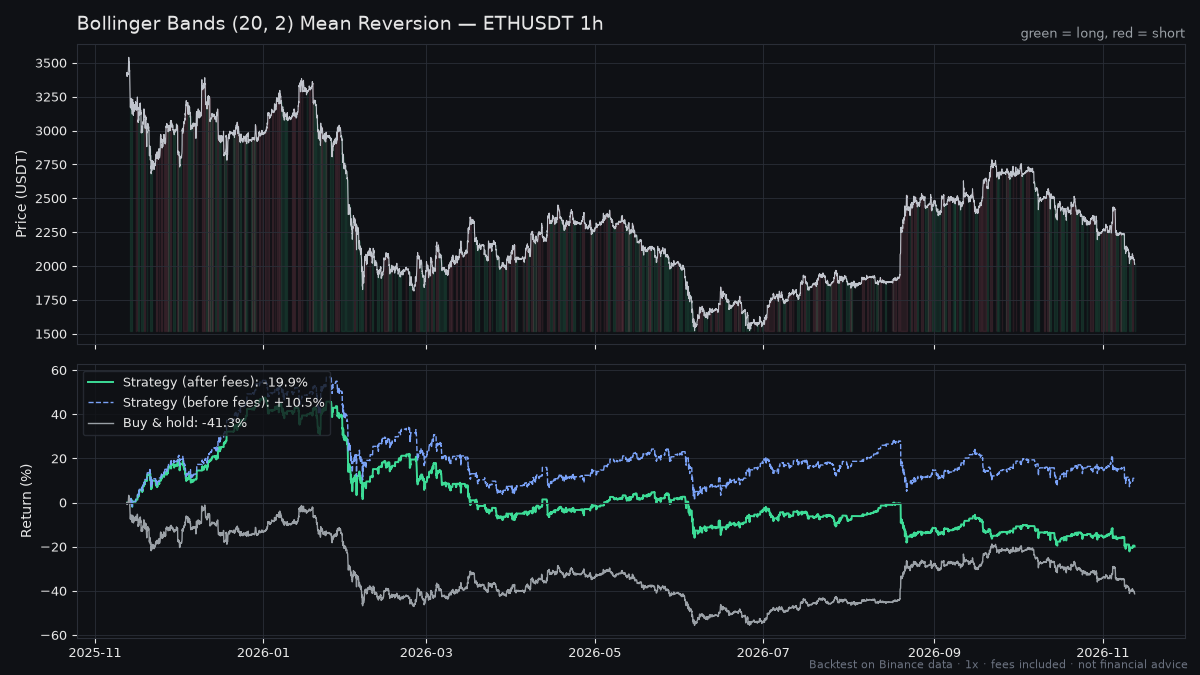
| ETHUSDT | 1h | 323 | 68.1% | +0.90% / -2.06% | -19.9% | +10.5% | -47.2% | -41.3% |
| ETHUSDT | 4h | 85 | 68.2% | +2.15% / -4.73% | -14.3% | -6.8% | -42.0% | -40.6% |
| SOLUSDT | 1h | 318 | 64.5% | +1.03% / -2.35% | -47.9% | -28.4% | -70.1% | -47.7% |
| SOLUSDT | 4h | 82 | 67.1% | +2.57% / -5.03% | -7.7% | 0.0% | -47.0% | -46.1% |
The worst run, BTC on 1h. It lost 49.1% while simply holding BTC lost 29.0%:
The clearest fee story, ETH on 1h. It was +10.5% before fees and -19.9% after:
The least-bad run, BTC on 4h. It finished at -1.5%, but only after a -33.0% drawdown:
What the numbers actually say
1. A high win rate is not an edge. Every run won at least 60.1% of its trades, and every run lost money. In every run the average loss was roughly twice the average win. On BTC 1h, wins averaged +0.64% and losses averaged -1.46%. The structure explains it. Exiting at the middle band caps the winners. With no stop, nothing caps the losers when price keeps walking along the band.
2. Fees turned the only two profitable runs into losers. Before fees, just two runs made money: ETH 1h at +10.5% and BTC 4h at +7.1%. After fees they were -19.9% and -1.5%. The 1h runs made 318 to 323 trades and paid 31.8% to 32.2% of capital in fees at 0.05% per side. The 4h runs paid 8.2% to 8.4%.
3. The 4h chart beat the 1h chart on every symbol. BTC went from -49.1% on 1h to -1.5% on 4h. ETH went from -19.9% to -14.3%, and SOL from -47.9% to -7.7%. Sharpe ratios tell the same story: -2.06, -0.37 and -1.25 on 1h, versus 0.09, -0.18 and 0.03 on 4h. Fewer trades meant less fee drag. Less bad is still not good.
4. Beating buy & hold in a down year is a low bar. Buy & hold lost between 28.0% and 47.7% over this period. The strategy lost less than holding in four of six runs: BTC 4h, ETH 1h, ETH 4h and SOL 4h. It did worse on BTC 1h (-49.1% vs -29.0%) and roughly tied on SOL 1h (-47.9% vs -47.7%). Losing less than a falling market is not making money. Doing nothing would have beaten all six runs.
5. The drawdowns are severe, even at 1x. Max drawdowns ranged from -33.0% to -70.1%. On SOL 1h, the strategy's drawdown of -70.1% was deeper than buy & hold's full-year loss of -47.7%. Add leverage and those drawdowns grow with it.
How to test it yourself on TradingView
- Open BINANCE:BTCUSDT, ETHUSDT or SOLUSDT and set the chart to 1h or 4h.
- Add the built-in Bollinger Bands indicator. Confirm length 20, StdDev 2, source close, SMA basis.
- In the Pine Editor, write a strategy using
ta.bb(close, 20, 2.0). Enter long onta.crossover(close, lower)and short onta.crossunder(close, upper). Close each position when price reaches the basis (middle band). - In Strategy properties, set commission to 0.05% per order and size orders at your full equity with no leverage. Enable processing orders on bar close to match our fills at the signal close, and turn pyramiding off.
- Restrict the test to 2025-11-12 through 2026-11-12. Compare net profit, max drawdown and buy & hold against the table above. Expect small differences, because fill logic differs between engines. Then add slippage and see how much worse it gets.
Verdict
As tested, Bollinger Bands (20, 2) mean reversion did not work on BTC, ETH or SOL over this year. It lost money on all six market and timeframe combinations, after fees and at 1x. It suits no one as a ready-to-trade system. On 1h, fees alone cost around a third of capital. The 4h version is the only sensible starting point for further research. BTC 4h was +7.1% before fees, which hints at a thin raw signal. The things worth testing are the weaknesses the data exposed: a stop-loss or trend filter to cut the oversized losses, and lower costs per trade. Treat any change as unproven until it survives its own backtest with fees.
FAQ
Does Bollinger Bands mean reversion work for crypto? Not in our test. From 2025-11-12 to 2026-11-12, the (20, 2) setup lost money after fees on BTC, ETH and SOL, on both 1h and 4h. Net returns ranged from -1.5% to -49.1%.
Why does a strategy with a high win rate still lose money? Because the size of wins and losses matters more than how often you win. Here, wins were capped at the middle band while losses had no stop. The average loss was roughly twice the average win, which outweighed win rates of 60.1% to 68.2%.
What is the best timeframe for a Bollinger Bands strategy? Of the two we tested, 4h was clearly less bad than 1h on every symbol. The 1h runs traded 318 to 323 times and paid 31.8% to 32.2% of capital in fees. But no timeframe we tested was profitable after fees, and we only tested the default (20, 2) settings.